Behavioral productsCase study
Behavioral energy products.
Using behavioral science and clear data to help people use less energy at home.
Back to all work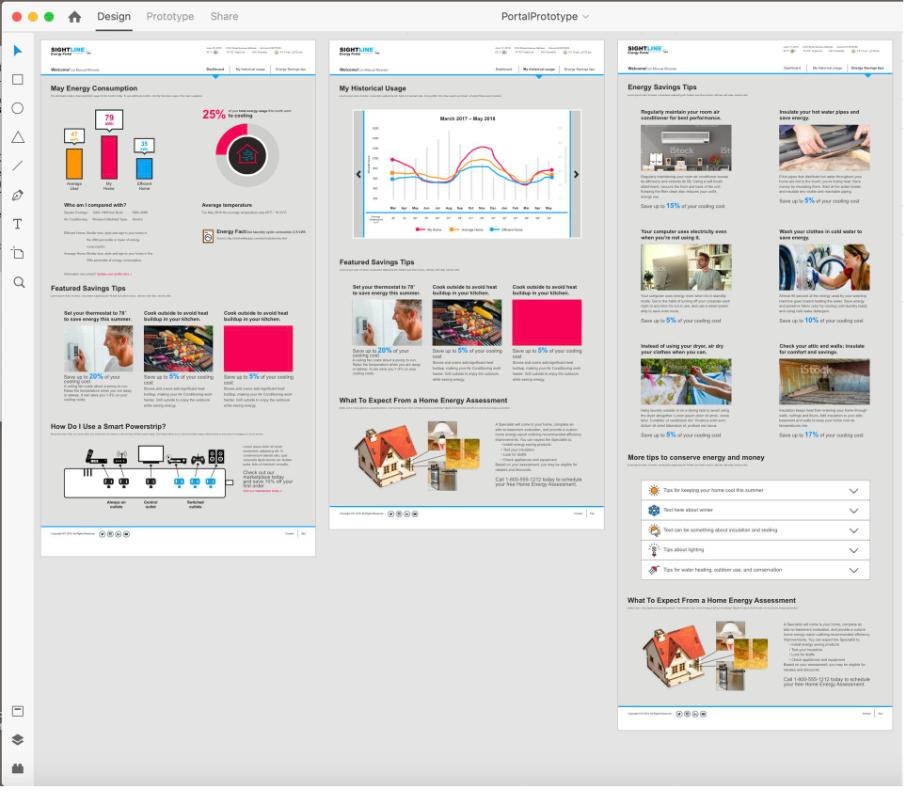
- Role
- Design lead and front-end engineer; lead designer, behavioral products
- Clients
- Utilities including Georgia Power and PSO
- Channels
- Print, email, desktop, and mobile
- Result
- 35% increase in email open rates
Why it works
People save energy when they can see how they compare.
Home energy reports work through social norms: showing people how their usage compares to similar homes and to efficient ones, then giving them an easy next step. Done well, they disrupt old habits, build intrinsic motivation, and make future costs feel real. Residential energy use is more than a fifth of annual emissions, so small nudges at scale add up.
Home energy reports
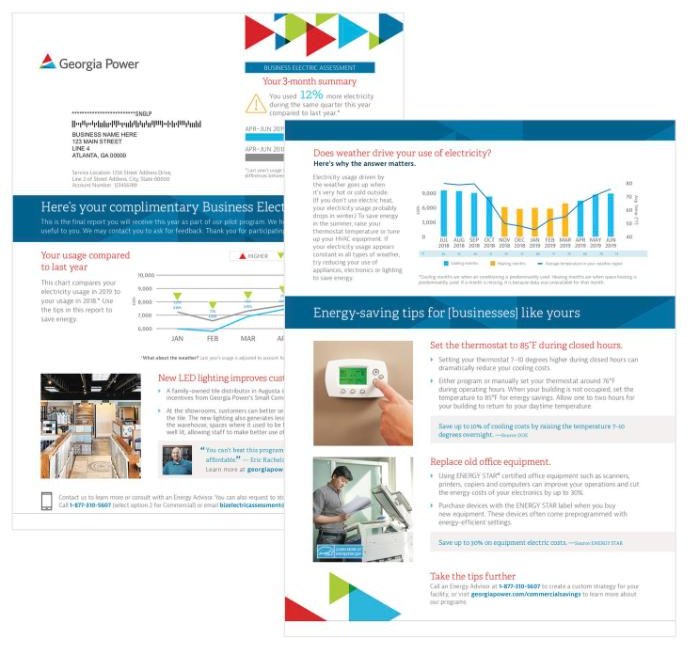
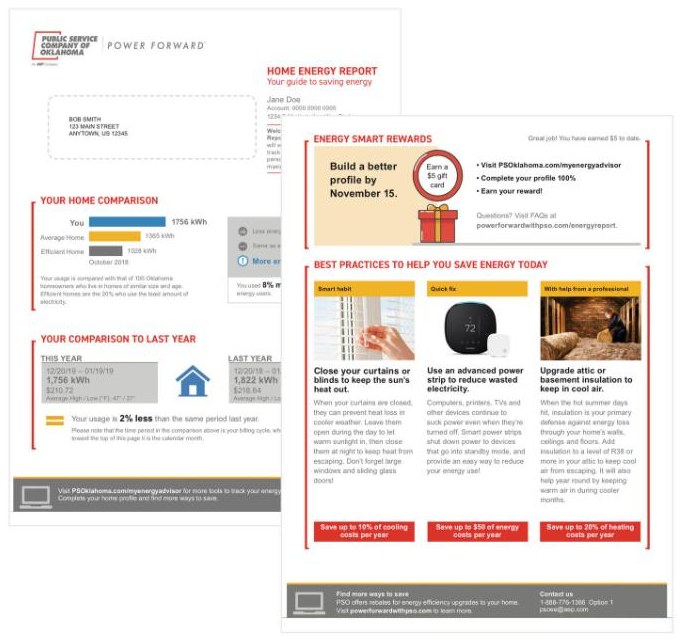
- 01Print, rebuiltRedesigned reports for Georgia Power and PSO around clear usage data, savings potential, and specific recommendations.
- 02One template, thousands of reportsA dynamic base template with XMpie data integration, so every customer’s usage, savings, and tips populate automatically.
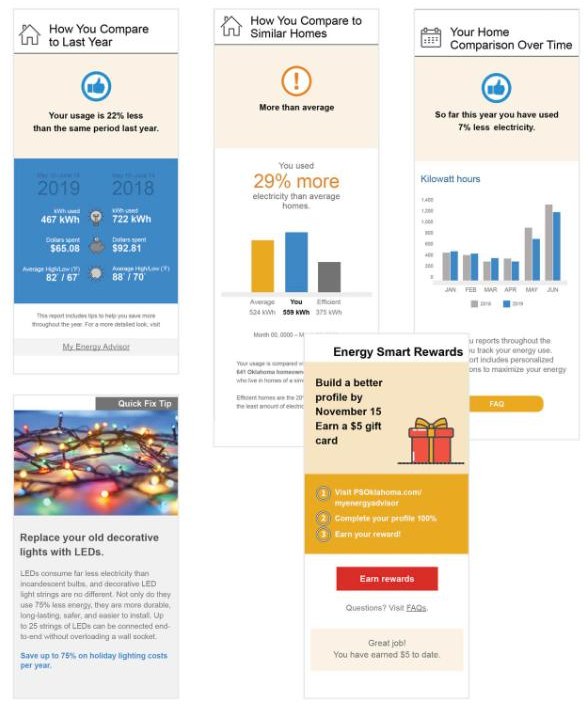
- 03Email as its own formatMobile first. Heavy photography was hurting deliverability in Gmail, so I simplified the design and rethought the data visualization.
- 04A shared design systemHeader levels, icons, color, judgment boxes, and chart standards, so print and digital feel like one brand.
Print and email
Clear comparisons, specific next steps
Each report answers the same three questions: how you compare to last year, how you compare to similar homes, and what you can do about it this month.
Energy portal
A portal people would come back to
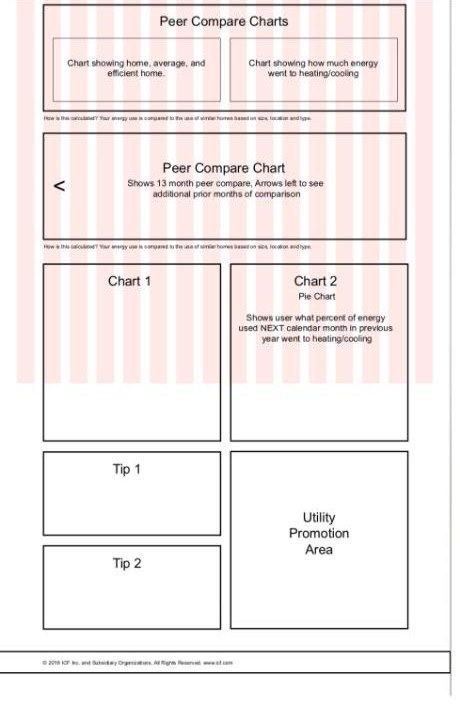
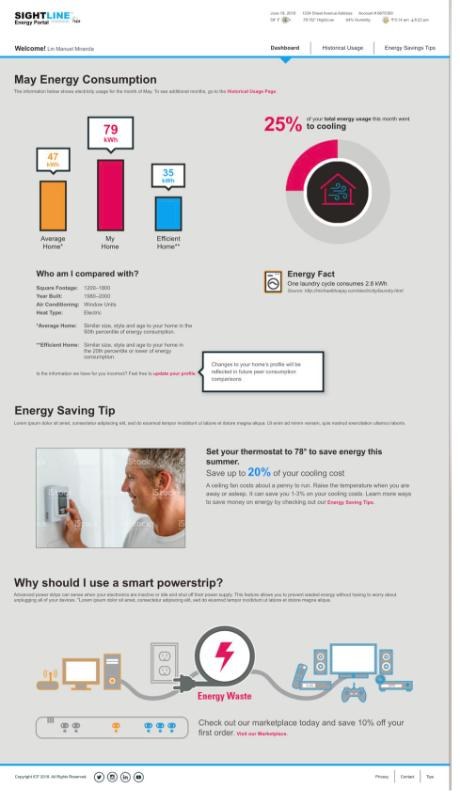
The energy portal had to match competitors’ core features and then give people a reason to return. I wireframed social features like community challenges and rewarded tasks, then built high-fidelity prototypes that used color and interactive charts where competitors used white space and tables.
I also set the research questions: what people try to click that isn’t clickable, whether they trust peer comparisons, whether calendar months or billing cycles make more sense, and whether there’s enough value to come back.
Make the next step obvious.
What changed
The redesigned email reports raised open rates by 35%, and print and digital finally looked and felt like one product. The dynamic template let utilities personalize reports for thousands of customers without hand-building each one.